Detailed Financial Review
Critical accounting policies
The Group's significant accounting policies are set out in Note 1 to the Group's Annual Report and Accounts.
Preparation of the consolidated financial statements requires Directors to make estimates and assumptions that affect the reported amounts in the consolidated financial statements and accompanying notes. Actual outcomes could differ from those estimated.
The Directors believe that the accounting policies discussed below represent those which require the greatest exercise of judgement. The Directors have used their best judgement in determining the estimates and assumptions used in these areas but a different set of judgements could result in material changes to our reported results. The discussion below should be read in conjunction with the full statement of accounting policies, set out in Note 1 to the Group's Annual Report and Accounts.
Property, plant and equipment
Rental fleet accounts for £1,015 million, or around 93%, of the net book value of property, plant and equipment used in our business; the great majority of equipment in the rental fleet is depreciated on a straight-line basis to a residual value of zero over 8 years, although we do have some classes of non-power fleet which we depreciate over 10 years. The annual fleet depreciation charge of £175 million (2010: £147 million) relates to the estimated service lives allocated to each class of fleet asset. Asset lives are reviewed regularly and changed if necessary to reflect current thinking on their remaining lives in light of technological change, prospective economic utilisation and the physical condition of the assets.
Intangible assets
In accordance with IFRS 3 (revised) 'Business Combinations', goodwill arising on acquisition of assets and subsidiaries is capitalised and included in intangible assets. IFRS 3 (revised) also requires the identification of other acquired intangible assets. The techniques used to value these intangible assets are in line with internationally used models but do require the use of estimates and forecasts which may differ from actual outcomes. Future results are impacted by the amortisation period adopted for these items and, potentially, by any differences between forecast and actual outcomes related to individual intangible assets. The amortisation charge for intangible assets in 2011 was £4 million (2010: £3 million). Substantially all of this charge relates to the amortisation of intangible assets arising from business combinations.
Goodwill of £65 million (2010: £60 million) is not amortised, but is tested annually for impairment and carried at cost less accumulated impairment losses. The impairment review calculations require the use of forecasts related to the future profitability and cash generating ability of the acquired assets. There were no impairment charges in 2011 and 2010.
Taxation
Aggreko's pre-exceptional effective tax charge of 28.5% is based on the profit for the year and tax rates in force at the balance sheet date. As well as corporation tax, Aggreko is subject to indirect taxes such as sales and employment taxes across various tax jurisdictions in the approximate 100 countries in which the Group operates. The varying nature and complexity of tax law requires the Group to review its tax positions and make appropriate judgements at the balance sheet date. In addition, the recognition of deferred tax assets is dependent upon an estimation of future taxable profits that will be available, against which deductible temporary differences can be utilised. In the event that actual taxable profits are different, such differences may impact the carrying value of such deferred tax assets in future periods. Further information, including a detailed tax reconciliation, is shown at Notes 9 and 20 to the Annual Report and Accounts.
Trade receivables
Trade receivables are recognised initially at fair value and subsequently measured at amortised cost. An impairment is recorded for the difference between the carrying amount and the recoverable amount where there is objective evidence that the Group may not be able to collect all amounts due. Significant financial difficulties of the debtor, probability that the debtor will enter bankruptcy or financial reorganisation and default, or large and old outstanding balances, particularly in countries where the legal system is not easily used to enforce recovery, are considered indicators that the trade receivable is impaired.
The majority of the contracts into which the Group enters are small relative to the size of the Group and, if a customer fails to pay a debt, this is dealt with in the normal course of business. However, some of the contracts the Group undertakes in developing countries are very large, and are in jurisdictions where payment practices can be unpredictable. The Group monitors the risk profile and debtor position of all such contracts regularly, and deploys a variety of techniques to mitigate the risks of delayed or nonpayment; these include securing advance payments and guarantees. As a result of this rigorous approach to risk management, the Group has historically had a low level of bad debt. When a trade receivable is uncollectable it is written off against the provision for impairment of trade receivables. At 31 December 2011 the provision for impairment of trade receivables in the balance sheet was £36 million (2010: £33 million).
Currency translation
The movement of exchange rates during the year decreased revenue and trading profit by £26 million and £9 million respectively as a result of currency movement. Currency translation also gave rise to a £12 million decrease in the value of net assets as a result of year-on-year movements in the exchange rates. Set out in the table below are the principal exchange rates which affect the Group's profits and net assets.
|
Per £ Sterling |
||||
|
2011 |
2010 |
|||
|
Average |
Year End |
Average |
Year End |
|
|
Principal Exchange Rates |
||||
|
United States Dollar |
1.60 |
1.54 |
1.55 |
1.55 |
|
Euro |
1.15 |
1.19 |
1.17 |
1.16 |
|
Other Operational Exchange Rates |
||||
|
UAE Dirhams |
5.89 |
5.66 |
5.68 |
5.69 |
|
Australian Dollar |
1.55 |
1.52 |
1.68 |
1.52 |
|
Source: Bloomberg |
||||
Reconciliation of underlying growth to reported growth
The table below reconciles the reported and underlying revenue and trading profit growth rates:
|
Revenue |
Trading profit |
|
|
2010 |
1,230 |
312 |
|
Currency |
(26) |
(9) |
|
2010 pass-through fuel |
(74) |
(2) |
|
2011 pass-through fuel |
108 |
2 |
|
Underlying growth including events |
158 |
35 |
|
2011 |
1,396 |
338 |
|
2010 FIFA World Cup, Asian Games & VANOC |
(87) |
|
|
2011 revenue from Asian Games & London Olympics |
6 |
|
|
As reported growth |
14% |
8% |
|
Underlying growth |
22% |
26% |
|
2009 |
1,024 |
253 |
|
Currency |
23 |
7 |
|
2009 pass-through fuel |
(58) |
(2) |
|
2009 53rd week |
(16) |
(10) |
|
2010 pass-through fuel |
74 |
2 |
|
Underlying growth including events |
183 |
62 |
|
2010 |
1,230 |
312 |
|
2009 VANOC |
(9) |
|
|
2010 FIFA World Cup, Asian Games & VANOC |
87 |
|
|
As reported growth |
22% |
26% |
|
Underlying growth |
11% |
11% |
Interest
The net interest charge was £18 million, an increase of £8 million on 2010 reflecting the higher level of average net debt mainly as a consequence of increased levels of capital expenditure and the return of £148 million of capital to shareholders. Interest cover, measured against rolling 12-month EBITDA, remains very strong at 28.4 times (2010: 47.1 times).
Taxation
Tax strategy
In 2011 Aggreko had operations in around 100 countries across the world. For each country in which we operate, we ensure that we pay the appropriate amount of tax so that we comply with the laws of the relevant country and with the Group's tax policies and guidelines. We aim to be transparent in terms of where we pay tax, recognising the importance of tax receipts to countries in which we do business. Aggreko's tax strategy is aligned with the Group's business strategy and is reviewed and endorsed regularly by the Board. This strategy is executed by a global team of tax professionals who are integrated into our business and who are based in a variety of locations across the world.
Our tax strategy covers the application of all taxes, both direct and indirect, to our business including corporation tax, payroll taxes, value added tax and customs duties. The tax strategy also covers our approach to any tax planning required by the business and key policy areas such as transfer pricing.
Given the number of countries in which we operate, local compliance is a key area of focus for Aggreko, particularly for our International Power Projects business, where we will generally only be in country for a relatively short period of time. The complexity and nature of tax rules in certain countries in which we operate makes tax compliance a key skill. We seek to manage this proactively by engaging with local tax authorities across the world, as appropriate, to agree and confirm our tax positions.
As a UK group, we are subject to the UK's senior accounting officer (SAO) legislation requiring us to certify that our systems are adequate for the purposes of calculating the Group's UK tax liabilities. We recently undertook a review which confirmed that our systems are appropriate for this purpose.
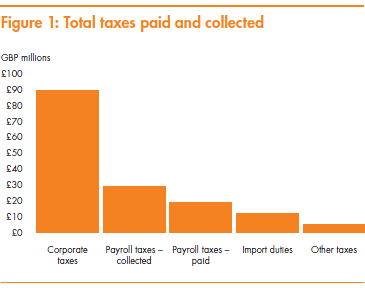
Total taxes
In 2011, Aggreko's worldwide operations resulted in direct and indirect taxes of £154 million being paid to tax authorities. This amount represents all corporate taxes paid on operations, payroll taxes, customs duty and miscellaneous other local taxes.
The breakdown of the £154 million by type of tax is shown in figure 1.
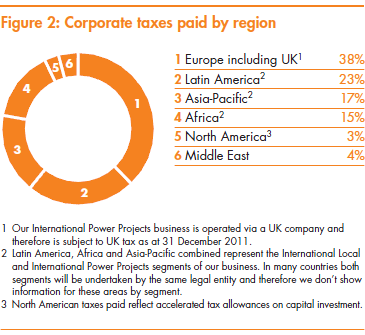
The £89 million corporate tax on operations broken down by region is shown in figure 2.
Tax charge
The Group's pre-exceptional effective corporation tax rate for the year was 28.5% (2010: 30.0%) based on a tax charge of £92 million on profit before taxation of £324 million. The reduction in the effective rate from 2010 to 2011 resulted from the combination of mix of profits between operating territories, the reduction in the UK statutory tax rate from 28% to 26% and a small net reduction in the level of corporate tax provisions held centrally. In quantifying the tax charge each year, the varying nature and complexity of tax legislation requires the Group to review its tax positions and make appropriate judgements. Further information, including a detailed tax reconciliation of the current year tax charge, is shown at Note 9 in the Annual Report and Accounts.
The UK Finance Act 2011 introduced legislation exempting the profits of foreign branches of UK resident companies from UK corporation tax; this is applicable to a significant portion of our International Power Projects business. The impact of this exemption was that in 2011 there was a release to the income statement of a previously created deferred tax liability of £29 million which will no longer crystallise. Given its size and nature, this release is treated as an exceptional item. Starting in 2012, we expect there will be an ongoing reduction of around three percentage points in the Group's effective tax rate. The exact amount of the reduction each year will be subject to the mix of countries where International Power Projects operates and the tax regime in those countries.
Reconciliation of income tax statment tax charge and cash tax paid
The Group's total cash taxes borne and collected was £154 million which differs from the tax charge reported in the income statement of £92 million. The income statement tax charge figure comprises corporate taxes only. These two figures are reconciled below.
|
£ million |
|
|
Cash taxes paid |
154 |
|
Non-corporate taxes |
(65) |
|
Corporate tax paid |
89 |
|
Movements in deferred tax |
6 |
|
Timing of payments |
(3) |
|
Tax charge pre-exceptional items per income statement |
92 |
Dividends
If the proposed final dividend of 13.59 pence is approved by shareholders, it will result in a full year dividend of 20.79 pence (2010: 18.90 pence) per ordinary share, giving dividend cover, on a preexceptional basis, of 4.2 times (2010: 4.2 times).
Cashflow
The net cash inflow from operations during the year totalled £509 million (2010: £468 million). This funded capital expenditure of £418 million, which was £149 million higher than in 2010. This spend was made up of £392 million of fleet and £26 million of non-fleet with 71% of the fleet investment supporting the continued expansion of our International business. Net debt at 31 December 2011 was £232 million higher than the previous year mainly as a result of the increase in total capital expenditure and the return of capital to shareholders of £148 million completed in July 2011. As a result of the increase in net debt, gearing (net debt as a percentage of equity) at 31 December 2011 increased to 42% from 16% at 31 December 2010 while net debt to EBITDA increased to 0.7 times (2010: 0.3 times).
There was a £38 million working capital outflow in the year, which reflected increased activity levels across the business. More specifically, Aggreko's working capital position tends to be heavily influenced by our International Power Projects business and also activity levels at our manufacturing operation. In International Power Projects, we saw an increase in all elements of working capital, which is to be expected given the 29% (including pass-through fuel) increase in revenues in the business. Although the absolute level of accounts receivable increased in International Power Projects, debtor days decreased by 18 days year on year to 67 days (on a count back basis) as we received payment during 2011 from a small number of countries where payments were slower than usual at the prior year end. Our manufacturing operation saw increases in inventory and accounts payable reflecting the increased level of production in 2011 and early 2012.
Net operating assets
The net operating assets of the Group (including goodwill) at 31 December 2011 totalled £1,354 million, £289 million higher than 2010. The main components of net operating assets are:
|
£ million |
||||
|
Movement |
||||
|
2011 |
2010 |
Headline |
Constant currency1 |
|
|
Rental fleet |
1,015 |
802 |
27% |
27% |
|
Property and plant |
72 |
57 |
27% |
28% |
|
Inventory |
147 |
118 |
25% |
26% |
|
Net trade debtors |
264 |
192 |
38% |
38% |
|
1 Constant currency takes account of the impact of translational exchange movements in respect of our businesses which operate in currency other than Sterling. |
||||
A key measure of Aggreko's performance is the return (expressed as operating profit) generated from average net operating assets (ROCE). We calculate the average net operating assets for a period by taking the average of the net operating assets as at 1 January, 30 June and 31 December; this is the basis on which we report our calculations of ROCE. The average net operating assets in 2011 were £1,224 million, up 26% on 2010. In 2011 the ROCE decreased to 28.0% compared with 32.4% in 2010. This decrease was due to increased working capital, and the absence of the major sporting events of 2010, which by their nature, were less capital intensive than the base business.
Acquisitions
On 31 March 2011, the Group completed the acquisition of the business and assets of N.Z. Generator Hire Limited for a total cash consideration of £14 million. The fair value of net assets acquired was £9 million resulting in goodwill of £5 million.
Shareholders' equity
Shareholders' equity increased by £64 million to £881 million, represented by the net assets of the Group of £1,246 million before net debt of £365 million. The movements in shareholders' equity are analysed in the table below:
|
Movements in shareholders' equity |
||
|
£ million |
£ million |
|
|
As at 1 January 2011 |
814 |
|
|
Profit for the financial year |
260 |
|
|
Dividend1 |
(52) |
|
|
Retained earnings |
208 |
|
|
New share capital subscribed |
2 |
|
|
Return of value to shareholders |
(148) |
|
|
Purchase of own shares held under trust |
(10) |
|
|
Credit in respect of employee share awards |
20 |
|
|
Actuarial losses on retirement benefits |
(5) |
|
|
Currency translation difference |
(12) |
|
|
Movement in hedging reserve |
(4) |
|
|
Other2 |
16 |
|
|
As at 31 December 2011 |
881 |
|
|
1 Reflects the final dividend for 2010 of 12.35 pence per share (2010: 8.23 pence) and the interim dividend for 2011 of 7.20 pence per share (2010: 6.55 pence) that were paid during the year. 2 Other mainly includes tax on items taken directly to reserves. |
||
The £232 million of post-tax profit (pre-exceptional items) in the year represents a return of 26% on shareholders' equity (2010: 26%) which compares to a Group weighted average cost of capital of 7.4%.
Pensions
Pension arrangements for our employees vary depending on best practice and regulation in each country. The Group operates a defined benefit scheme for UK employees, which was closed to new employees joining the Group after 1 April 2002; most of the other schemes in operation around the world are varieties of defined contribution schemes. The UK scheme will undergo a formal valuation at 31 December 2011. This valuation is expected to be completed during 2012.
Under IAS 19: 'Employee Benefits', Aggreko has recognised a pre-tax pension deficit of £6 million at 31 December 2011 (2010: £3 million) which is determined using actuarial assumptions. The increase in the pension deficit is a result of lower net interest rates to value the liabilities and lower than expected returns achieved on Scheme assets over the year, partially offset by the additional contributions made by the Company during the year over and above the cost of accrual of benefits. The Company paid £3 million in February 2011 in line with the Recovery Plan agreed for the Scheme following the actuarial valuation at 31 December 2008.
The main assumptions used in the IAS 19 valuation for the previous two years are shown in Note 25 of the Annual Report and Accounts. The sensitivities regarding these assumptions are shown in the table below.
Assumptions
|
Assumption |
Increase |
Deficit Change |
Income Change |
|
Rate of increase in salaries |
0.5% |
3.1 |
0.4 |
|
Rate of increase in pensions in payment |
0.5% |
4.2 |
0.4 |
|
Discount rate |
0.5% |
(8.3) |
(0.4) |
|
Inflation (0.5% increases on pensions increases, |
0.5% |
9.1 |
0.8 |
|
Expected return on Scheme assets |
0.5% |
n/a |
(0.3) |
|
Longevity |
1 year |
1.6 |
0.1 |
Capital structure
The intention of Aggreko's strategy is to deliver longterm value to its shareholders whilst maintaining a balance sheet structure that safeguards the Group's financial position through economic cycles.
In the last five years we have delivered growth of 394% in Total Shareholder Return – which compares with 8% and 4% for the FTSE 100 and FTSE 250 respectively. This value creation comes from two sources. First, our share price has increased as a result of the 34% compound growth in earnings per share; this earnings growth is the result of very high rates of capital investment in the business (about £1.4 billion invested over the last five years, compared with depreciation over the same period of about £770 million), along with one large and several small acquisitions (about £146 million spent over the last five years). The second source of investor return has been dividends which, in the last five years, have grown at a compound rate of 25%. In addition, in 2011 we had a special return to shareholders of 55 pence per share, worth £148 million.
With respect to our balance sheet structure, our objective is to safeguard the Group's financial position through economic cycles. Given the proven ability of the business to fund organic growth from operating cashflows, and the nature of our business model, we believe it is sensible to run the business with a modest amount of debt. We say 'modest' because we are strongly of the view that it is unwise to run a business which has high levels of operational gearing with high levels of financial gearing. Given the above considerations, we believe that a Net Debt to EBITDA ratio of around 1 times is appropriate for the Group over the longer term, which is the level the Group has run at, on average, since the Group listed on the Stock Exchange in 1997. Absent a major acquisition, or the requirement for an unusual level of fleet investment, this level gives us the ability to deal with the normal fluctuations in capital expenditure (which can be quite sharp: +/- £100 million in a year) and working capital, and is well within our covenants to lenders which stand at 3 times Net Debt to EBITDA.
At the end of 2010, Net Debt to EBITDA was around 0.3 times despite investing significantly ahead of depreciation over the previous few years. This reflected the highly cash generative nature of the business model and in particular the high returns earned in our fast growing International Power Projects business. Given this level of gearing relative to our target of around 1 times, we decided to make a return of capital to shareholders thereby increasing the ratio of Net Debt to EBITDA to 0.7 times at 31 December 2011. This was completed in July 2011 by way of a B share scheme which returned 55 pence per share (approximately £148 million) to shareholders. Our priority remains to invest in the organic growth of our business supported by bolt-on acquisitions but, if we still have the capacity, we will continue to review the potential for future returns of value.
Treasury
The Group's operations expose it to a variety of financial risks that include liquidity, the effects of changes in foreign currency exchange rates, interest rates, and credit risk. The Group has a centralised treasury operation whose primary role is to ensure that adequate liquidity is available to meet the Group's funding requirements as they arise, and that financial risk arising from the Group's underlying operations is effectively identified and managed.
The treasury operations are conducted in accordance with policies and procedures approved by the Board and are reviewed annually. Financial instruments are only executed for hedging purposes, and transactions that are speculative in nature are expressly forbidden. Monthly reports are provided to senior management and treasury operations are subject to periodic internal and external review.
Liquidity and funding
The Group maintains sufficient facilities to meet its normal funding requirements over the medium term. At 31 December 2011, these facilities totalled £669 million in the form of committed bank facilities arranged on a bilateral basis with a number of international banks and private placement notes. The private placement was completed during the first half of 2011. The financial covenants attached to these facilities are that EBITDA should be no less than 4 times interest and net debt should be no more than 3 times EBITDA; at 31 December 2011, these stood at 28 times and 0.7 times respectively. The Group does not consider that these covenants are restrictive to its operations. The maturity profile of the borrowings is detailed in Note 17 in the Annual Report and Accounts. Since the year end we have put in place a further £30 million of committed facilities.
Net debt amounted to £365 million at 31 December 2011 and, at that date, un-drawn committed facilities were £289 million.
Interest rate risk
The Group's policy is to minimise the exposure to interest rates by ensuring an appropriate balance of fixed and floating rates. The Group's primary funding is at floating rates through its bank facilities. In order to manage the associated interest rate risk, the Group uses interest rate swaps to vary the mix of fixed and floating rates. At 31 December 2011, £260 million of the net debt of £365 million was at fixed rates of interest resulting in a fixed to floating rate net debt ratio of 71:29 (2010: 84:16).
Foreign exchange risk
The Group is subject to currency exposure on the translation into Sterling of its net investments in overseas subsidiaries. In order to reduce the currency risk arising, the Group uses direct borrowings in the same currency as those investments. Group borrowings are predominantly drawn down in the principal currencies used by the Group, namely US Dollar, Euro and Sterling.
The Group manages its currency flows to minimise foreign exchange risk arising on transactions denominated in foreign currencies and uses forward contracts, where appropriate, in order to hedge net currency flows.
Credit risk
Cash deposits and other financial instruments give rise to credit risk on amounts due from counterparties. The Group manages this risk by limiting the aggregate amounts and their duration depending on external credit ratings of the relevant counterparty. In the case of financial assets exposed to credit risk, the carrying amount in the balance sheet, net of any applicable provision for loss, represents the amount exposed to credit risk.
Insurance
The Group operates a policy of buying cover against the material risks which the business faces, where it is possible to purchase such cover on reasonable terms. Where this is not possible, or where the risks would not have a material impact on the Group as a whole, we self-insure.